
South Charlotte Report · November 2026
Baxter
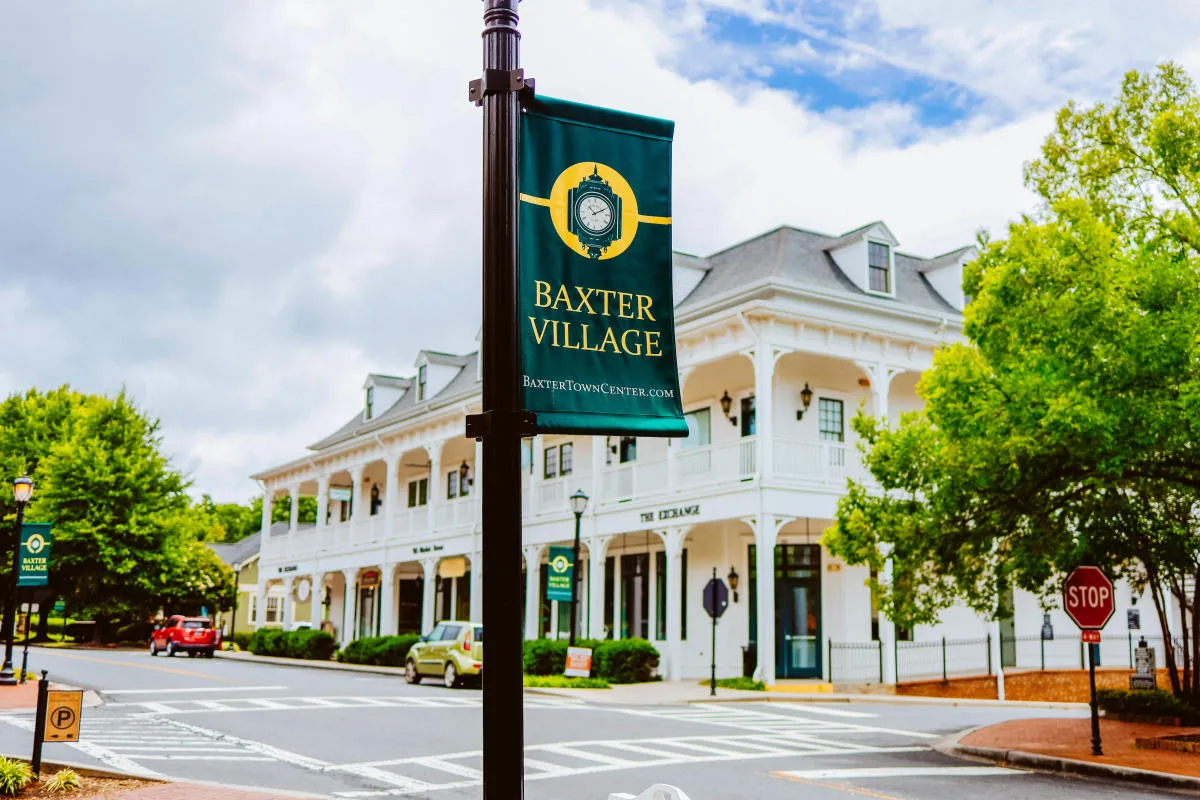
Baxter Village in Fort Mill, South Carolina. Single-family homes at $700,000 and above, past 12 months.
The Short Version
Baxter in Four Points
By Price Point
Baxter at a Glance
$700,000 to $1 Million
- Median price
- $850,000
- Per sq. ft.
- $281
- Days on market
- 15.5
- Of original list
- 96.6%
- For sale now
- 8
- Months of supply
- 2.7
$1 Million to $3 Million
- Median price
- $1,095,000
- Per sq. ft.
- $299
- Days on market
- 26
- Of original list
- 95.0%
- For sale now
- 2
- Months of supply
- 1.5
$3 Million and Above
- Median price
- n/a
- Per sq. ft.
- n/a
- Days on market
- n/a
- Of original list
- n/a
- For sale now
- 0
- Months of supply
- n/a
The Details
Every Sale in the Past 12 Months
Show all 51 sales and current listings
| Address | Closed | Sale price | Sq. ft. | Per sq. ft. | Days on market | Of original list |
|---|---|---|---|---|---|---|
| 2436 Commons Court | Nov 10, 2026 | $1,000,000 | 3,604 | $277 | 108 | 83.3% |
| 341 Elis Way | Oct 28, 2026 | $925,000 | 3,254 | $284 | 11 | 100.0% |
| 1840 Second Baxter Crossing | Oct 28, 2026 | $1,066,000 | 3,553 | $300 | n/a | n/a |
| 626 Pomegranate Place | Oct 26, 2026 | $1,400,000 | 4,896 | $286 | 53 | 88.9% |
| 739 Julia Street | Oct 16, 2026 | $830,000 | 3,104 | $267 | 123 | 92.2% |
| 4843 Milford Way | Oct 15, 2026 | $845,000 | 2,786 | $303 | 7 | 100.0% |
| 4341 Birkshire Heights | Oct 9, 2026 | $1,045,000 | 3,632 | $288 | 36 | 95.4% |
| 929 Gardenia Street | Sep 30, 2026 | $890,000 | 3,218 | $277 | 24 | 99.0% |
| 5752 Morris Hunt Drive | Sep 30, 2026 | $888,000 | 3,293 | $270 | 72 | 92.6% |
| 545 Glen Walk Drive | Sep 29, 2026 | $770,000 | 2,806 | $274 | 26 | 96.3% |
| 7124 Michael Scott Crossing | Sep 24, 2026 | $850,000 | 2,911 | $292 | 0 | 100.0% |
| 189 Mills Lane | Sep 22, 2026 | $1,090,000 | 3,832 | $284 | 135 | 92.8% |
| 5101 Downing Drive | Sep 17, 2026 | $917,000 | 3,447 | $266 | 68 | 97.0% |
| 1871 Second Baxter Crossing | Sep 4, 2026 | $980,000 | 3,530 | $278 | 60 | 96.6% |
| 1075 Gardenia Street | Aug 31, 2026 | $1,025,000 | 3,430 | $299 | 52 | 86.9% |
| 887 Stratford Run Drive | Aug 19, 2026 | $900,000 | 3,290 | $274 | 36 | 80.0% |
| 3229 Colonel Springs Way | Aug 11, 2026 | $906,000 | 3,073 | $295 | 26 | 95.4% |
| 7160 Michael Scott Crossing | Aug 10, 2026 | $815,000 | 2,903 | $281 | 3 | 100.0% |
| 716 Shady Grove Crossing | Jul 28, 2026 | $783,000 | 2,847 | $275 | 3 | 98.0% |
| 5595 Morris Hunt Drive | Jul 24, 2026 | $855,500 | 3,075 | $278 | 78 | 86.9% |
| 325 Elis Way | Jul 7, 2026 | $759,999 | 2,307 | $329 | 22 | 95.0% |
| 4844 Milford Way | Jun 30, 2026 | $990,000 | 3,405 | $291 | 4 | 99.5% |
| 786 Stratford Run Drive | Jun 29, 2026 | $789,000 | 2,490 | $317 | n/a | n/a |
| 664 Revival Row | Jun 23, 2026 | $1,100,000 | 3,445 | $319 | n/a | n/a |
| 2616 Nations Commons Street | Jun 12, 2026 | $1,075,000 | 2,879 | $373 | 3 | 98.2% |
| 676 Revival Row | Jun 11, 2026 | $975,000 | 3,406 | $286 | 2 | 101.0% |
| 1920 Clark Elliott Street | Jun 11, 2026 | $1,175,000 | 3,825 | $307 | 16 | 98.3% |
| 629 Revival Row | Jun 5, 2026 | $1,225,000 | 3,238 | $378 | 0 | 102.1% |
| 4074 Birkshire Heights | Jun 5, 2026 | $990,000 | 3,455 | $287 | n/a | n/a |
| 204 Mills Lane | May 22, 2026 | $759,000 | 2,554 | $297 | 3 | 100.0% |
| 2578 Lower Assembly Drive | May 21, 2026 | $767,000 | 2,389 | $321 | 1 | 100.9% |
| 4333 Birkshire Heights | May 15, 2026 | $765,000 | 2,420 | $316 | 2 | 100.0% |
| 614 Pomegranate Place | May 4, 2026 | $1,275,000 | 4,956 | $257 | 46 | 91.1% |
| 5518 Morris Hunt Drive | May 1, 2026 | $960,000 | 3,450 | $278 | n/a | n/a |
| 907 Dericks Crossing | Apr 28, 2026 | $1,300,000 | 4,664 | $279 | 2 | 108.3% |
| 3264 Richards Crossing | Apr 20, 2026 | $855,000 | 3,420 | $250 | 1 | 101.9% |
| 3019 Colonel Springs Way | Apr 17, 2026 | $719,000 | 2,122 | $339 | 1 | 101.4% |
| 4261 Birkshire Heights | Apr 16, 2026 | $767,000 | 2,502 | $307 | 2 | 99.0% |
| 4265 Birkshire Heights | Apr 15, 2026 | $770,000 | 2,530 | $304 | 20 | 96.9% |
| 927 Dericks Crossing | Apr 14, 2026 | $1,090,000 | 4,322 | $252 | n/a | n/a |
| 220 Mills Lane | Apr 3, 2026 | $750,000 | 2,450 | $306 | 1 | 100.0% |
| 5215 Beacon Court | Mar 31, 2026 | $965,000 | 3,502 | $276 | 8 | 97.5% |
| 5029 Downing Drive | Mar 16, 2026 | $1,000,000 | 3,162 | $316 | 9 | 95.2% |
| 3539 Richards Crossing | Mar 13, 2026 | $759,500 | 2,976 | $255 | 6 | 94.9% |
| 5510 Morris Hunt Drive | Jan 21, 2026 | $962,500 | 3,236 | $297 | 109 | 96.4% |
| 5023 Downing Drive | Jan 21, 2026 | $1,175,000 | 2,862 | $411 | n/a | n/a |
| 2424 Commons Court | Dec 18, 2025 | $1,400,000 | 3,925 | $357 | 0 | 100.0% |
| 545 Glen Walk Drive | Dec 12, 2025 | $700,000 | 2,806 | $249 | 27 | 93.3% |
| 5227 Beacon Court | Dec 2, 2025 | $887,500 | 3,210 | $276 | 25 | 93.4% |
| 878 Promenade Walk | Dec 1, 2025 | $870,000 | 3,198 | $272 | 85 | 97.3% |
| 720 Shady Grove Crossing | Nov 20, 2025 | $740,000 | 2,919 | $254 | 85 | 87.2% |
A dash means the home was not publicly marketed through the MLS before it sold.
For Sale and Under Contract
| Address | Status | Original list price | Sq. ft. | Built |
|---|---|---|---|---|
| 643 Bracket Street | Active | $1,187,000 | 4,123 | 2004 |
| 869 Stratford Run Drive | Active | $1,050,000 | 3,148 | 2006 |
| 2561 Lower Assembly Drive | Active | $959,900 | 2,489 | 2001 |
| 3249 Richards Crossing | Active | $939,900 | 2,900 | 2001 |
| 882 Promenade Walk | Active | $915,000 | 3,501 | 2005 |
| 2440 Commons Court | Active | $900,000 | 3,343 | 2003 |
| 904 Tuckerton Drive | Active | $874,900 | 3,347 | 2006 |
| 723 Julia Street | Active | $849,900 | 3,023 | 2001 |
| 3328 Richards Crossing | Active | $849,900 | 3,076 | 2007 |
| 544 Glen Walk Drive | Active | $749,000 | 2,244 | 2000 |
Source: Canopy MLS, single-family homes at $700,000 and above. Closed sales November 18, 2025 to November 17, 2026; active and under-contract listings as of November 18, 2026. Days on market is the median cumulative days on market. Sale-to-list is the sale price as a percentage of the original list price, averaged. Months of supply is active listings divided by the average monthly sales pace. Active listings are grouped by original list price. Neighborhoods with fewer than five sales are directional only. Information deemed reliable but not guaranteed.
Your Home in Today's Market
What Would Your Home Sell For Right Now?
A private valuation from David, built on the same Canopy MLS data behind this report.